A and B sat on a pipe
We can imagine A and B sitting down to pass the time of day – in our case, not on a simple pipe, but on a fire bucket. We'll now explain the 'universal' meaning of these parametrical factors A and B (more correctly A_r, B_r, A_h, B_h, A_v and B_v) included in the approximation expressions of stages 2, 5 and 8 (fig. 6.41-43).
Viewing the fuzzy set as a statistical distribution, A represents the 'spread' of the distribution, and B the parameter value giving the peak of the distribution. Imagine we carry out a global statistical experiment. We measure for all adult humans some parameter – weight, height, intelligence, etc – whether represented numerically or estimated by some criterion (genius, talented, very clever, simply clever... down to idiot). The data points we shall transform into a curve (see sections 1-3 in figures 6.41, 6.42
and 6.43) where the X-axis is the measured human parameter, and the Y-axis the percentage of people with a given value of that parameter. We carry out this statistical exercise separately for men (M) and women (F). What do we get?
Case 1: AM = AF, but BM > BF:
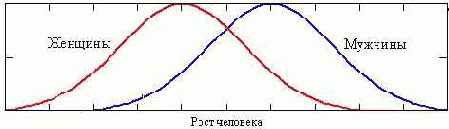
Curves turn out like this for parameters – such as height, weight, strength of muscles, etc – pertaining particularly to men rather than women. This is related to evolution: sexual dimorphism is related to the general trend in species size. If the male body is larger than the female, the next generation tends to be larger. With spiders, for example, the male is much smaller than the female, and so – thank God – spiders are smaller now than the geological past.
Case 2: AM < AF, but BM = BF:
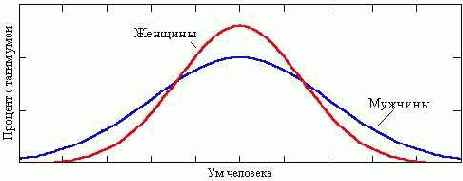
The curve looks like this for a parameter – intelligence – whose importance applies equally to both sexes, and has not varied for millennia. Many consider it quite proven, that if modern humans were suddenly stripped of education and culture, we would be no more intelligent (maybe even less so) than the Ancient Greeks. It's not known why, but there is a greater spread for men: there are more men of genius (Nobel prizewinners, inventors, writers and artists – at the right edge of the diagram) only because there are also more men of extremely subnormal intelligence (the left edge). The average woman is cleverer the average man: the centre of the "female" distribution is raised at the expense of a smaller spread. The areas of both curves is, however, identical: no offence intended to anyone, but we believe that the Lord God or Nature (whichever you believe in) has shown consideration in distributing intelligence equally to both halves of humanity.
We can try to apply the theory of fuzzy sets, as described in Etude 3, to the problem of computer piracy. The law divides all people into two precise sets: {legal users of programs} and {illegal users – pirates}. In real life, it's much more complex: computer users fall into two fuzzy sets, with a great variety of motives. At one extreme are people trading 'black' disks at Gorbushka (the left-hand axis of the diagram above); at the other are those who work only with legal copies and have never broken any license agreement (the right-hand axis). Again, it's possible to construct a humpbacked statistical curve, this time above an axis "sinner ... saint" describing the condition of the computer market in a particular country. Where does the maximum of this curve lie, and how is it shifting with time?